Growth and Fitness
through Innovation
How to
augment the returns
from your stake
© Klaus G. Saul
3. Produce best value
New self-referential learning curves introduced by R.G. Cooper of the McMaster University in Hamilton/Canada have demonstrated how to absorb the uncertainty which is associated with innovative visions and how to extract the meaningful information content out of relevant business cases.Thanks to the new expertise advanced innovation managers are now in a position to identify the most promising business proposals with a reliability of about 75-80%.
3-1
The growth of
economic value has two aspects which are as distinct as the two sides of a coin. Both
aspects, indeed, can never be regarded together at the same time. One aspect is the
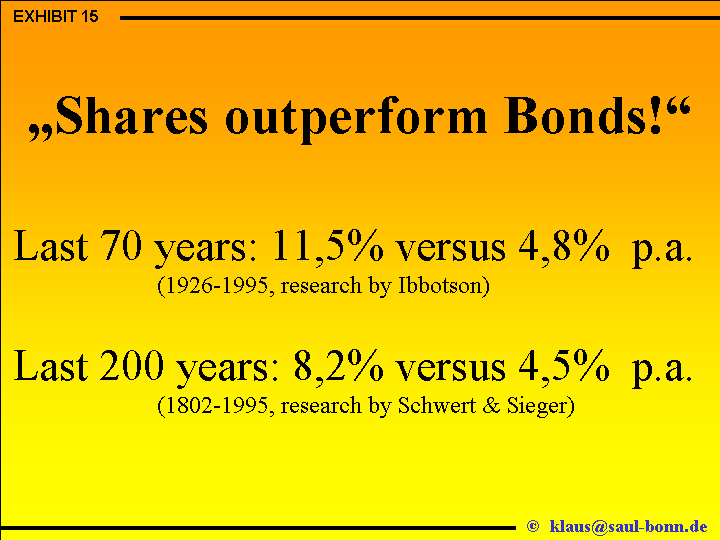
socio-economic one which as in [EXHIBIT 15] can be looked upon retrospectively.

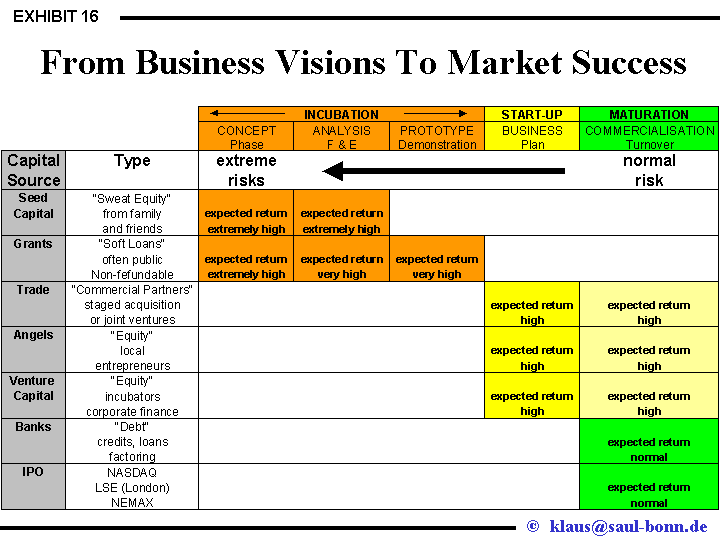
The other aspect is linked to the microscopic world of the individual stakeholders [EXHIBIT 16].
3-2
Whereas the
socio-economic aspect is almost insensitive to risks and opportunities the micro-cosmos of
the individual stakeholders is almost dominated by them. Indeed, the opportunity of an
individual stakeholder to win an average innovative venture instead of totally losing the
stake is 1 over 3 in accordance with [EXHIBIT 1]
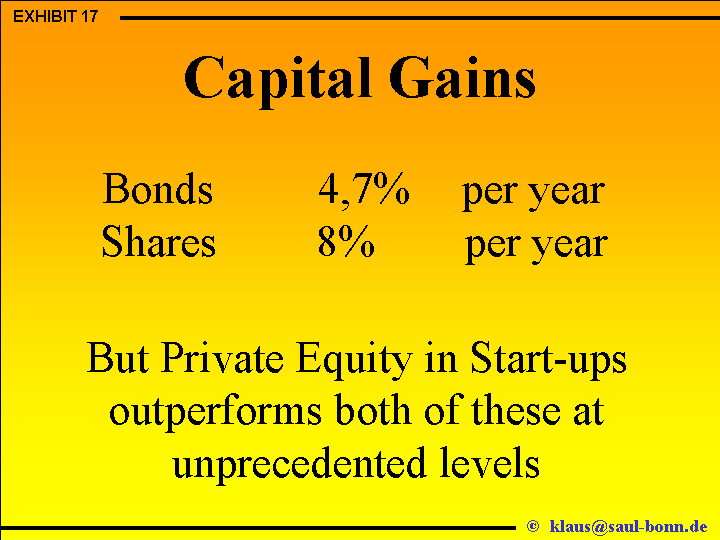
But fortunately there have been made very enlightening empirical investigations enabling modern innovation managers to forecast and consequently control the opportunities for individual stakeholders to win innovative ventures instead of losing the invested money. This new capability that was gained allows to envisage mean annual growth rates for capital value creation through innovative ventures to rise by a factor of 8.
3-3
The progress was
made possible thanks to a group around R.G. Cooper of the McMaster University in
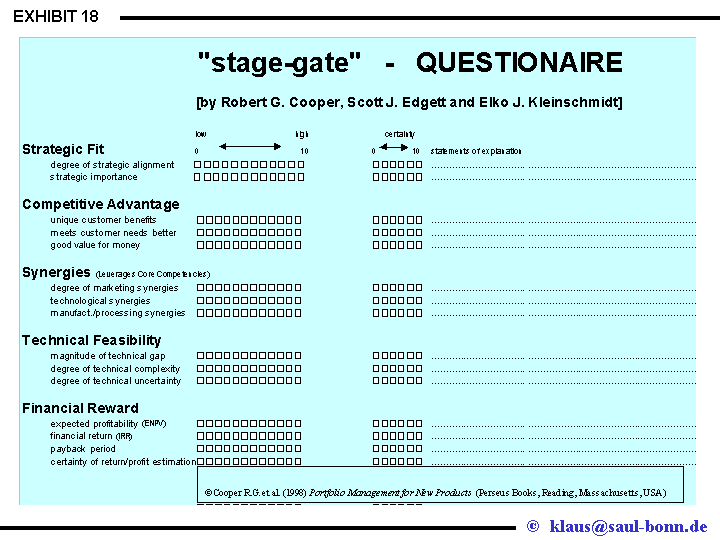
Hamilton/Canada. Cooper and collaborators conceived and stepwise improved a reference
system {Cooper,
R.G. (1993)} built upon a set of indicative criteria. With this set they meticulously
analysed more than 1,000 business cases from 125 American, Asian and European companies.
3-4
By gradually
adjusting the predictive weight of the indicators from the learning curve Cooper,
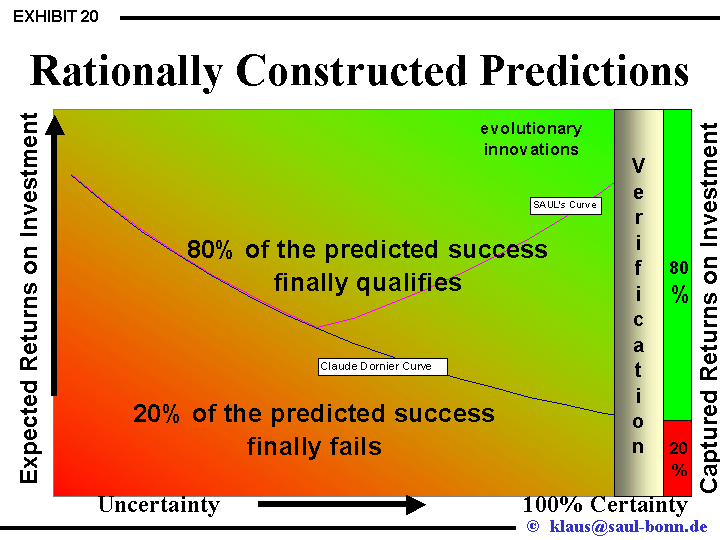
Kleinschmidt and Geschka could show that a mere 20% of their forecasts {Kleinschmidt, E. (1996)}
were wrong after all returns had been added up. With reference to this experience modern
innovation management {Cooper, R.G. (1998)} is now in a position to
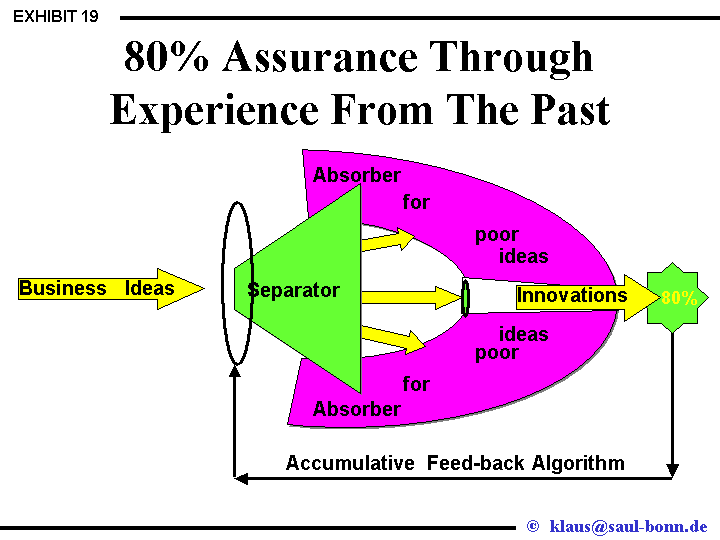
provide innovation assessments of 75-80% reliability if there is access to a statistically
significant basis of 60 - 100 reference cases from which to extract the meaningful
information content for entering into the appropriate "Accumulative Feed-back
Algorithm".
3-5
Cooper’s
results are unsurpassed so far. Moreover there are reasons to believe that
Cooper's criteria present a limit for the actually accessible prognostic power. This is why
Cooper’s "stage-gate" criteria have been accepted as standard benchmark world-wide.
3-6
The specific
advantage of Coopers’s approach consists in the capacity of predicting threatening
loss before the investments are made.
The notion of possible loss enables the suppression of useless action. It makes
investments more valuable than it was possible in the past.
3-7
If e.g. the
chances for failure or success are equally distributed , then half of the investment gets
lost without Cooper's assessments. With the lessons learned from Cooper however, we can suppress losses with an 80% certainty. The
reduction of loss from 50% to 20% raises the gain factor to 1.6.
3-8
If on the other
hand the options for success and failure are distributed as 1/9, then the Cooper procedure
reduces losses from 90% to 20% with a gain factor of 8.
LITERATURE

Dr. Klaus G. SAUL; Leiter Fachausschuss S1.3
INNOVATIONSMANAGEMENT
DEUTSCHE GESELLSCHAFT FÜR LUFT- UND RAUMFAHRT - LILIENTHAL- OBERT e.V. (DGLR) 53175 Bonn